WELCOME TO DORITOOL
The emergence of high-throughput data in biology has increased the need for functional in ‘silico’ analysis by developing integrative bioinformatics tools.
DoriTool, is a comprehensive, easy, and friendly pipeline integrating biological data from different functional tools with the aim of maximazing reproducibility, facilitate the obtention of biologically meaningful data and reducing the working time of the researchers, especially those with limited bioinformatic skills.
DoriTool is, the most complete bioinformatic tool offering functional ‘in silico’ annotation of variants previously associated with a trait of interest, shedding light on the underlying biology and helping the researchers in the interpretation and discussion of the results at mutation/variant level, Gene level; Pathway level and at Network level, by combining up-to-date functional and genomic data integrating also third-party bioinformatics tools in a pipeline. DoriTool uses GRCh37 human assembly and online mode.
DoriTool provides nice visual reports including variant annotation, linkage disequilibrium proxies, gene annotation, gene ontology analysis, eQTLs results from GTEx and coloured pathways.
Here we show also DoriTool functionalities by applying it to a dataset of 23 variants associated with drug addiction.
Project development, GitHub Repository (https://github.com/doritool/doritool)
Download
- Install Docker from the official web site
- Linux
- Mac
- Window (In case it is needed, use docker toolbox )
- Notice: Activate BIOS VT-X/AMD-v if is not enabled. Enabling it in the BIOS is mandatory
-
Download/Update the Docker image from Docker Hub with the next command ( the image will be downloaded, be patient)
docker pull doritool/doritool - See the next section for learning how to run the doritool Docker image
Quick start
1) Go to GitHub Repository at https://github.com/doritool/doritool and read the Readme.md file. DoriTool uses _GRCh37_ human assembly.
Read TROUBLESHOOTING.md file in case you are not able to run DoriTool
2) Input data a mutation/variant call format file (VCF) or an rs identifier SNP list.
3) Perform the functional in silico analysis from the shell as follows bellow
-
Linux users
docker run --rm -u "$(id -u):$(id -g)" -v "$(pwd)":/home/vep/doritool doritool/doritool -
Windows users
docker run --rm -u 1000 -v %cd%:/home/vep/doritool doritool/doritool %*
Run one of these scripts with the next parameters
3.1. Variant annotation analyslis (without Linkage Disequilibrium and eQTLs).
There are two ways to specify the input file (-- file, -i file )
-i web.rs
-- web.rs
3.2. Variant annotation analysis with linkage Disequilibrium (–LD , -l). Notice the cutoff must be specified. LD needs input rs.
-l 0.90 -i web.rs
--LD 0.90 -i web.rs
3.3. Variant annotation analysis with eQTLs (--GTEx , -e). Notice that the specific human tissue required must be downloaded previously from
https://www.gtexportal.org/home/
--GTEx Brain_Caudate_basal_ganglia_Analysis.nominal.filtered.txt -i web.rs
-e Brain_Caudate_basal_ganglia_Analysis.nominal.filtered.txt -i web.rs
3.4.Variant annotation analysis with Linkage Disequilibrium and eQTLs
-l 0.90 -e Brain_Nucleus_accumbens_basal_ganglia_Analysis.nominal.filtered.txt -i web.rs.
DoriTool allows performing a functional ‘in silico’ analysis at
-
Mutation/variant level, performing annotation of a set of mutations/variants, reporting eQTL results from GTEx and providing their linkage disequilibrium (LD) proxies.
-
Gene level, performing annotation of the genes tagged by the set of input variants and reporting also their Gene Ontology.
-
Pathway level.
-
Network level.
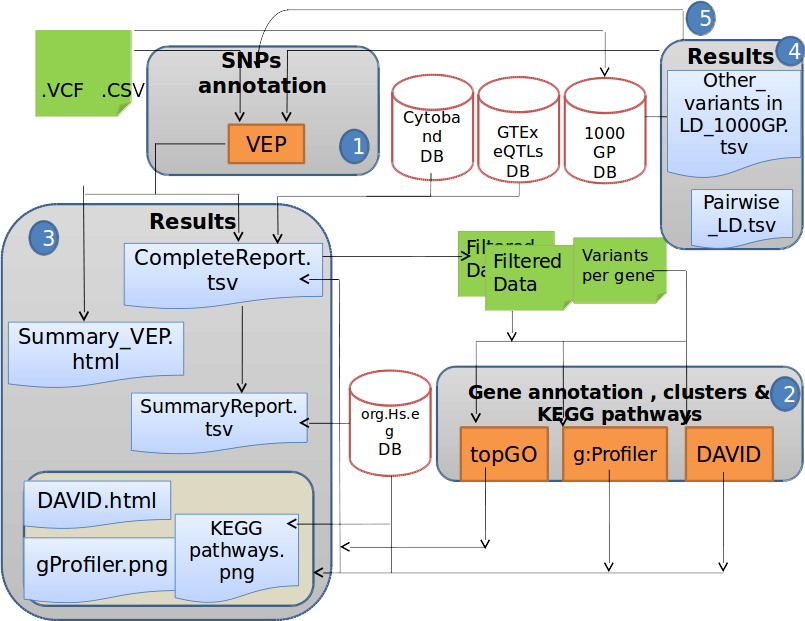
Schematic diagram of the DoriTool architecture. The workflow starts with an input file (VCF format, list of chromosome positions of the variants and their alleles or list of variant rs identifiers).
1) Variant Effect Predictor annotates the input variants with the tagged gene, the impact and some annotations described in the main text, querying Ensembl database. The next step involves locating the variants in their corresponding cytobands, and the user has the option to query the GTEx database locally by providing a tissue-specific file with the eQTLs.
2) DoriTool uses topGO (FGNet), g:Profiler and DAVID (FGNet) R packages to produce Gene Ontology terms, functional networks, enriched pathways and other annotations.
3) The main output files are the CompleteReport that contains all the annotations at transcript level provided by VEP, the SummaryReport that includes only felected information from the former, and collapsing the results by gene and effect in the transcript.
4) As an option, the user may ask for Linked variants in a window size of 500 Kb, with an LD cutoff specified in the main call.
5) In case the user has asked the previous task, a new CompleteReport profiling the linked variants will be produced.
DoriTool was designed for a post-association analysis (e.g., GWAS, NGS). Here we present DoriTool outputs by applying it in to a dataset of 23 SNPs related with drug addiction which were selected ad hoc to show the scope and the full potential of DoriTool.
Click here to download SNPs file
Several output files were obtained: four text files (SummaryReport.tsv; CompleteReport.tsv; pairwise_LD.tsv; other_variants_in_LD_1000GP.tsv), an image (gprofilerResults.png), two HTML files (DAVID.html; Summary_VEP.html), and four folders (DAVID, KEGG, topGO and VEP), containing the results obtained in each module of DoriTool.
1) Mutation/variant level:
Input variants are functionally annotated using VEP for the analysis, annotation, and prioritization of genomic variants in both coding and non-coding regions. VEP allows determining the effect of the variants (SNPs) on genes, transcripts and proteins, as well as regulatory regions, non-genic variants, and including transcription factor binding sites (TFBS), using regularly updated data files that are distributed by Ensembl and its output follows a standard form (VCF). DoriTool also locates each variant in its corresponding cytoband, retrieving the information from the database downloaded from UCSC hg19.
SummaryReport.tsv is a tab-delimited text file containing in each row, apart from the input information related to the mutation/variant, its consequence defined by the Sequence Ontology (http://www.sequenceontology.org/), its impact (high, moderate, low, modifier), transcript quality flags (cds_start_NF: CDS 5’ incomplete, cds_end_NF: CDS 3’ incomplete), the symbol of the gene tagged by that variant (considering a region of 10 Kb upstream of the TSS and 5 Kb downstream of the gene end), information regarding the transcription factor binding site (TFBS) related to the variant, the nearest gene in case of intergenic variants, the Condel score (i.e., a consensus score considering SIFT and PolyPhen-2, which ranges 0-1, being 0 neutral and 1 deleterious), the cytoband, the KEGG pathway in which the tagged gene was annotated and the Gene Ontology term.
The ouput file CompleteReport.tsv is also a tab-delimited text file containing in each row, apart from the information reported in the SummaryReport.tsv file, additional information as feature identifier and feature type (e.g., transcript, regulatory feature…), position of the input variant in cDNA, coding sequence and protein position of the input variant, changed aminoacid, codon change (the alternative codons with the variant base in upper case), existing variation (dbSNP or COSMIC variations), distance to the transcription start site, strand of the feature, source of the symbol (e.g., VEGA, Ensembl or HGNC) and HGNC id.
Click here to download CompleteReport.tsv
- Expression QTLs (optional). For this specific dataset (taken from https://www.gtexportal.org/home/datasets) it was considered Brain_Caudate_basal_ganglia_Analysis.nominal.filtered.txt tissue-specific significant SNP- gene pairs to obtain the effect size of the eQTL as well as the eGene.
Click here to download variants_eQTLs.tsv
- Linkage Disequilibrium proxies (optional). DoriTool also explores proxy and putatively functional SNPs for a query SNP in a selected 1000GP population, using the Ensembl REST API in an integrated Perl script. It computes and returns pairwise LD values 1) among the input variants and 2) between each input variant and all other variants in a surrounding window. The default parameters in DoriTool for window size and strength of LD (r2) are 500 Kb and 0.90.
Click here to download pairwise_LD.tsv
Click here to download other_variants_in_LD_1000GP.tsv
2) Gene level: Gene annotation
DoriTool uses three different tools to perform the gene annotation, and therefore allowing interpreting and identifying the biological processes for the gene list tagged by the input list of mutations/variants. 2.1) org.Hs.eg.db annotation package. The Entrez Gene identifiers mapped to an Ensembl gene are obtained using the genome wide annotation for human org.Hs.eg.db. DoriTool retrieves the following gene information to annotate: Symbol, gene name, OMIM identifier (Online Mendelian Inheritance in Man) and focuses primarily on inherited or heritable genetic diseases), Gene Ontology identifiers, protein families (PFAM) and Pathway.
Click here to download genes_annotations.tsv
2.2) FGNet, which uses TopGO R package. topGO facilitates semi-automated enrichment analysis for Gene Ontology (GO) terms mapping the genes tagged by the input variants with the associated biological annotation terms (e.g. GO Terms), and then statistically examine the enrichment of gene members for each of the annotation terms on the basis of gene counts.
Click here to download SummaryReport.tsv
Click here to download CompleteReport.tsv
2.3) g:Profiler R package. g:Profiler performs Functional Enrichment Analysis, including transcription factor binding site predictions, Mendelian disease annotations, information about protein expression and complexes, statistically significant Gene Ontology terms, pathways and other gene function related terms. DoriTool manages the output given by g:Profiler as a visual report that complements and helps to interpret the results given by the other tools.
Click here to download gprofilerResults.png
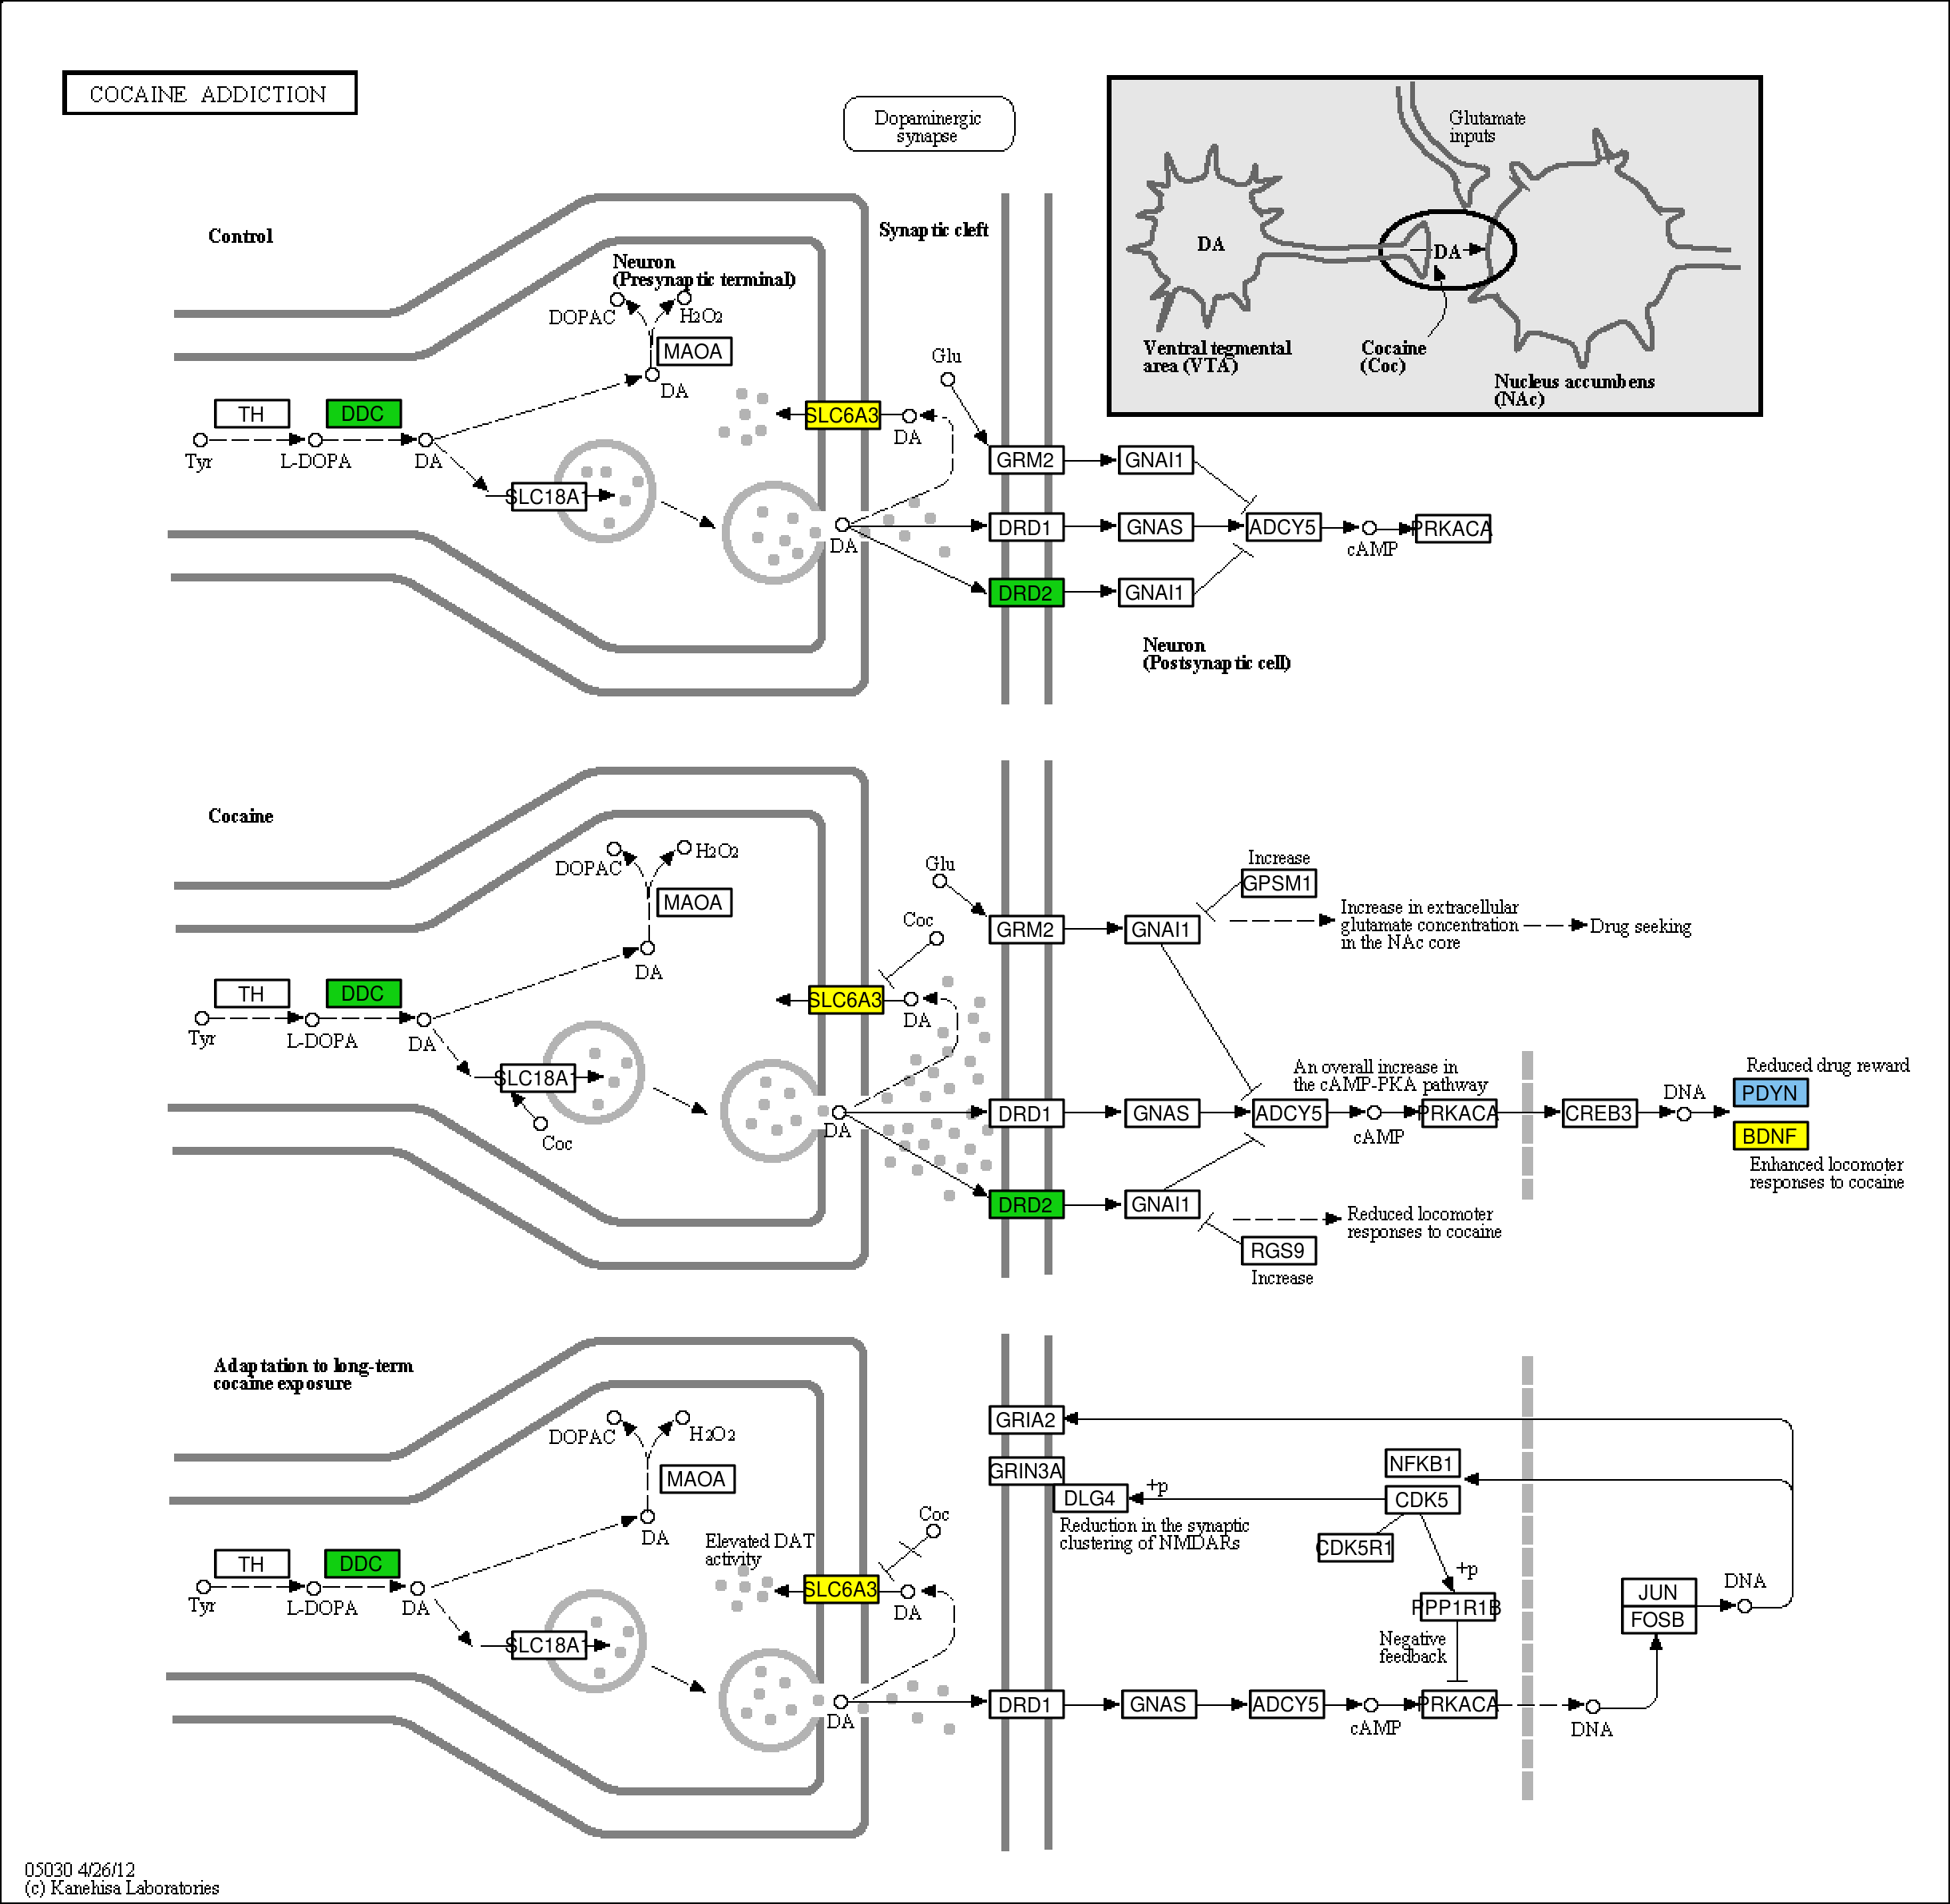
3) Pathway level: Pathway annotation.
It is performed using three R packages: FGNet, which uses DAVID, org.Hs.eg.db, which maps Entrez Gene identifiers to KEGG pathways. For the DoriTool pipeline, we included a code to obtain coloured KEGG pathways considering the number of variants per gene by using KEGGprofile.
Figure 1. Cocaine addiciton pathway
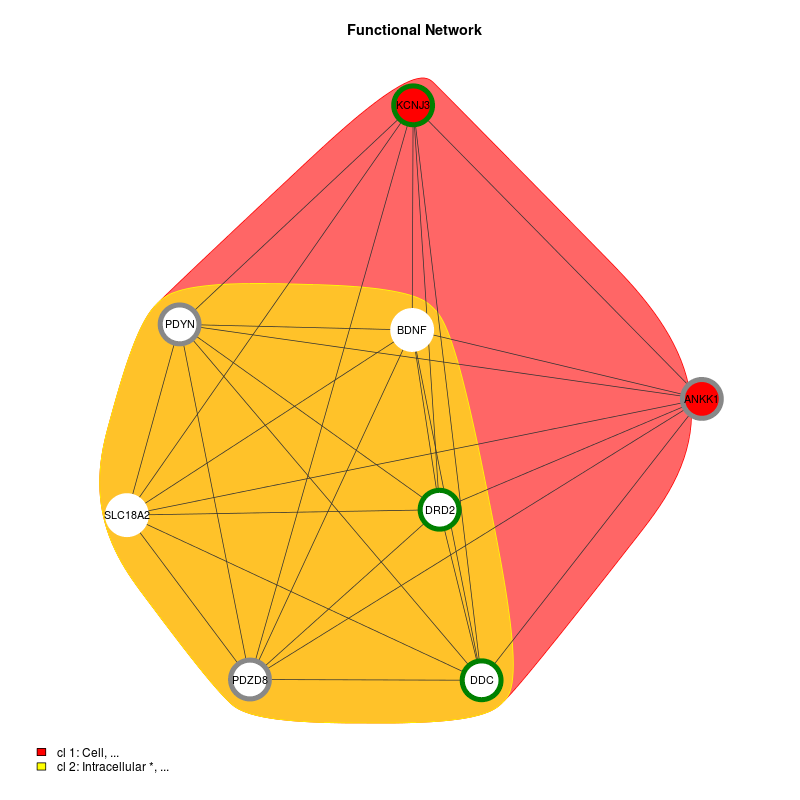
4) Network level
DoriTool also provides coloured Functional Networks of the list of genes tagged by the input variant list. These functional connections between the different genes were based on annotations (GO) and given by DAVID functions included in FGNet. Building functional networks provides an overview of the biological functions of the genes/terms, and permits links between genes, overlapping between clusters.
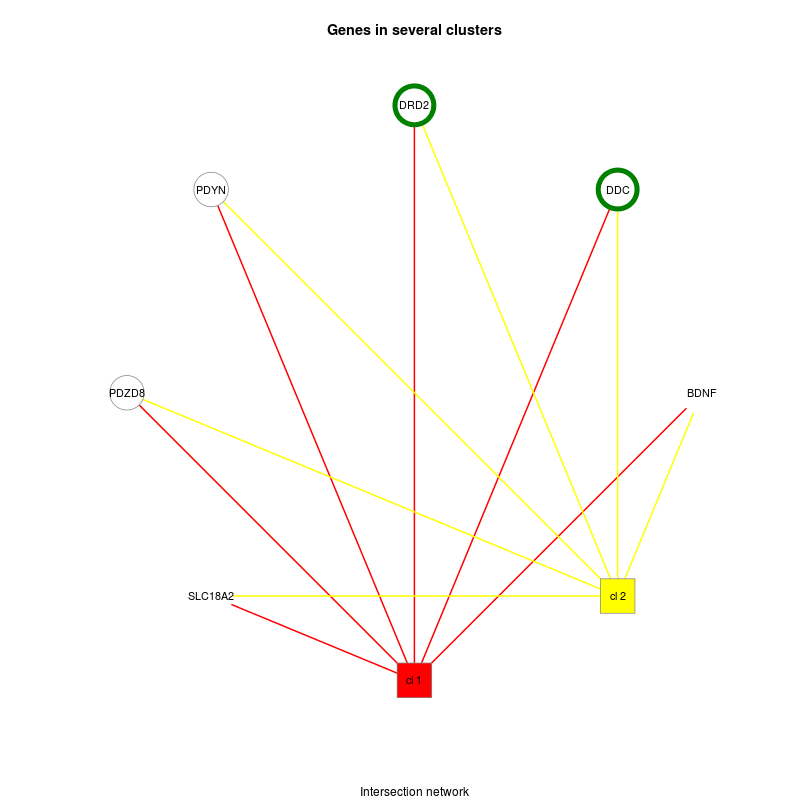
Figure 2. shows two clusters into gene-term groups in green (only one variant) and white circles (2 variants). Genes in solid colour have a unique cluster (and their color corresponds to the one shown in the legend), while genes with a white background are shared genes between clusters. The second shows the intersection network, which is a simplified functional network where all the genes that belong to only one metagroup are clustered into a single node. Clusters are represented by square boxes and genes are circles.
Figure 2. Functional Network
Citation
When using Doritool for a publication please cite as
Martín-Antoniano,I; Alonso,L; Madrid,M; López de Maturana, E; Malats,N. DoriTool: A bioinformatics integrative tool for post-association functional annotation. Public Health Genomics. 2017;20(2):126-135. doi: 10.1159/000477561 (https://doi.org/10.1159/000477561).
Feedback
Contact
Localization and support at:
-
Genetic and Molecular Epidemiology Group, Spanish National Cancer Research Centre (CNIO), Madrid, CIBERONC, Spain. C/Melchor Fernandez Almagro, 3, 28029, Phone: +34-912-246-900, Fax: +34-912-246-911
-
Instituto de Medicina Molecular Aplicada (IMMA), Facultad de Medicina, Universidad San Pablo CEU. Madrid, Spain. Urb. Montepríncipe Ctra. Boadilla, km 5,30028668 Boadilla del Monte (Madrid). Phone: +34914 56 63 00

![]()